
Access for all
Following publication of its latest diversity report, CILEx Regulation examines the CILEX membership data, what it tells us about the characteristics of members and highlights emerging trends

CILEx Regulation is firmly committed to fair access to the profession for all those who work within the legal services market. EDI (equality, diversity and inclusion) is at the heart of all we do.
A key element of our EDI strategy is to ensure we have accurate data, to enable us to continue to build on our understanding of our regulated community.
“By closely analysing the unique characteristics of our members, we can recognise trends and make informed strategic decisions”CILEx Regulation publishes the information every two years and this year’s all-member Diversity Report draws on data from 16,757 CILEX members, nearly four times the number of individuals who provided data for the first survey back in 2017. The data is more complete than our previous collection, allowing us to build on our understanding of the membership and provide more accurate insights.
Thanks to all CILEX members for completing their personal data submission and helping to build this valuable data set. By closely analysing the unique characteristics of our members, we can recognise trends and make informed strategic decisions.
Key insights
Analysis of the data has shown us the following:
- At Chartered Legal Executive grade, males continue to advance their careers further than females. We can see this by looking at members who are Chartered Legal Executives and have made it to partnership level and breaking this down by gender. This shows more male Fellows have progressed to partnership compared to males in membership, while less female Fellows have attained partnership compared to the percentage of females in membership.
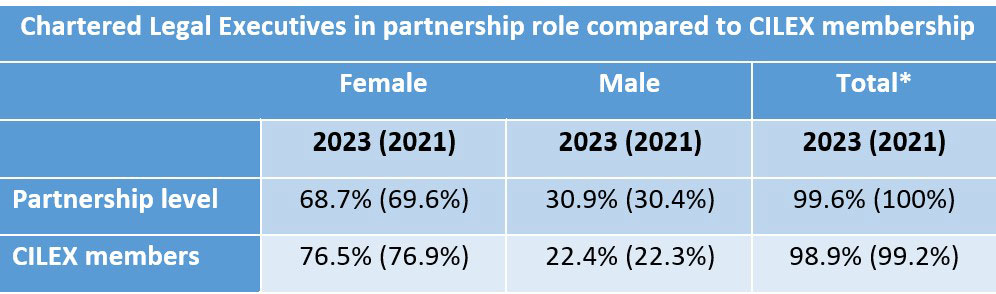
*some percentages do not total 100% because of prefer not to say responses
- Positively, there is strong evidence that the CILEX route into a legal career continues to be a popular choice for individuals from less affluent backgrounds. This is underpinned by the responses to the newly introduced questions on social economic backgrounds.
- The membership age profile continues to move upwards as members move into older age groups. Members aged 35 to 44 are increasing in number, with a reduction in members aged 25-34.
- There appears to be an under-declaration of disability for CILEX members compared to population rates for England and Wales. The disability declaration rate for Chartered Legal Executives is itself a third of the rate amongst the broader membership.
- Looking at members in the Chartered Legal Executive grade, Black, Asian and minority ethnic members are not progressing their careers in the same way as White members. This is consistent with the 2019 and 2021 reports.
- The data continues to indicate the possibility that individuals from some ethnic minority backgrounds use the CILEX education and training pathway as a route to qualification as a solicitor.
CILEX and social mobility
We introduced a new question this year to capture socio-economic background (SEB). We did this alongside other legal professions to achieve consistency of data across the legal sector.
The question asks about the occupation of the main household earner when the member was aged 14.
The CILEX route, of course, offers the opportunity to combine studying alongside earning without the need to gain a law degree. This opens the possibility of a legal career to people from non-traditional backgrounds. This was supported by the responses to the new question which demonstrated:
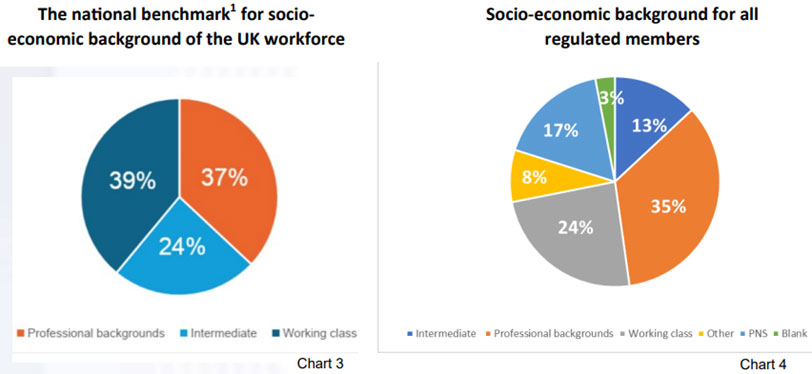
- The largest proportion of CILEX members (35%) come from professional backgrounds. This is slightly lower than proportion of the general UK population from professional backgrounds (37%) and substantially lower than the legal sector benchmark of 59%.
- Of CILEX members, 24% are working class compared with 39% of the UK population and 23% of the legal sector.
- The percentage of CILEX members from an ‘intermediate’ background – clerical, intermediate occupations and small business owners – was 13%, which is significantly lower than the UK (24%) and the legal sector (18%).
The national benchmark for socio-economic backgrounds of the UK workforce is shown in Chart 3 below which can be compared with the backgrounds of CILEX members in Chart 4.
You can find out more detail on the findings by reading the full CRL Diversity report 2023.